Figure 1
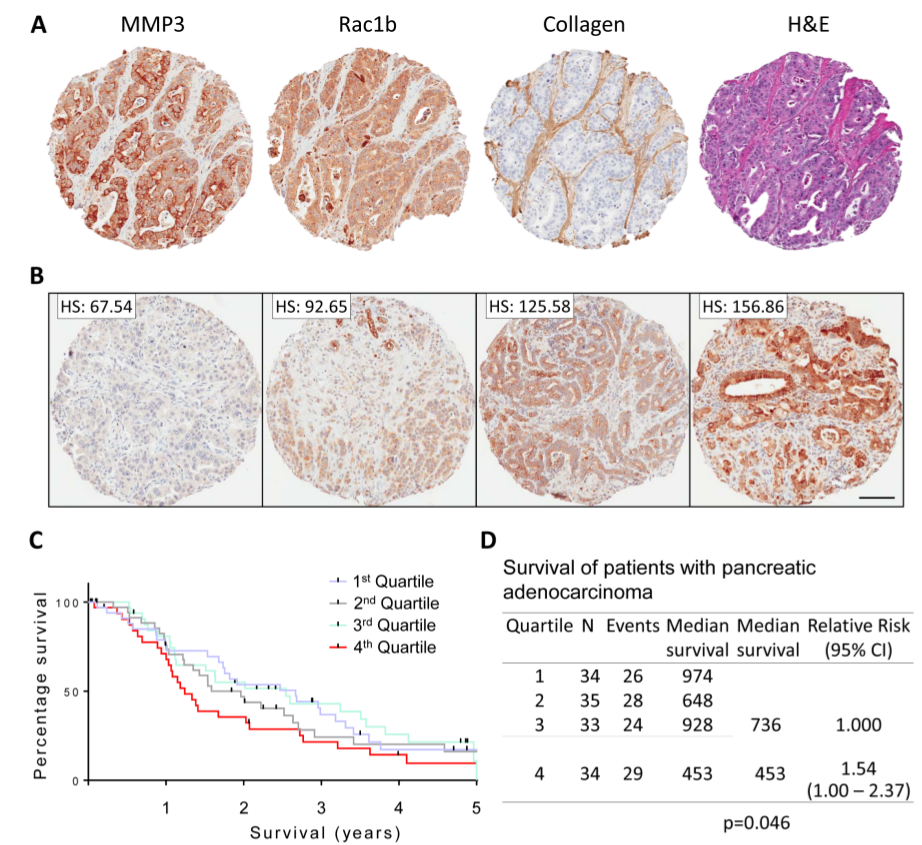
MMP3 and Rac1b tissue expression in pancreatic adenocarcinoma.
(A) Representative biopsy tissue spots stained with MMP3, Rac1b, collagen-I, and H&E showing clear staining signal within the tumor cells for MMP3 and Rac1b and stromal staining for collagen-I. (B) H-score generation and distribution of staining intensity into quartiles. Scale bar = 100um (C) Kaplan-Meier survival analysis among the patients separated into quartiles. (D) Survival analysis comparing low MMP3 expressing quartiles 1-3 and high MMP3 expressing quartile 4.


